

Article originally appeared on Real Investment Advice (HERE)
It is often said that one should never discuss religion or politics as you are going to wind up offending someone. In the financial world it is mentioning the “R” word.
The reason, of course, is that it is the onset of a recession that typically ends the “bull market” party. As the legendary Bob Farrell once stated:
“Bull markets are more fun than bear markets.”
Yet, recessions are part of a normal and healthy economy that purges the excesses built up during the first half of the cycle.
Since “recessions” are painful, as investors, we would rather not think about the “good times” coming to an end. However, by ignoring the risk of a recession, investors have historically been repeatedly crushed by the inevitable completion of the full market and economic cycle.
But after more than a decade of an economic growth cycle, investors have become complacent in the idea that recessions may have been mostly mitigated by monetary policy.
While monetary policy can certainly extend cycles, they cannot be repealed.
Given that monetary policy has consistently inflated asset prices historically, the reversions of those excesses have been just as dramatic. The table below shows every economic recovery and recessionary cycle going back to 1873.
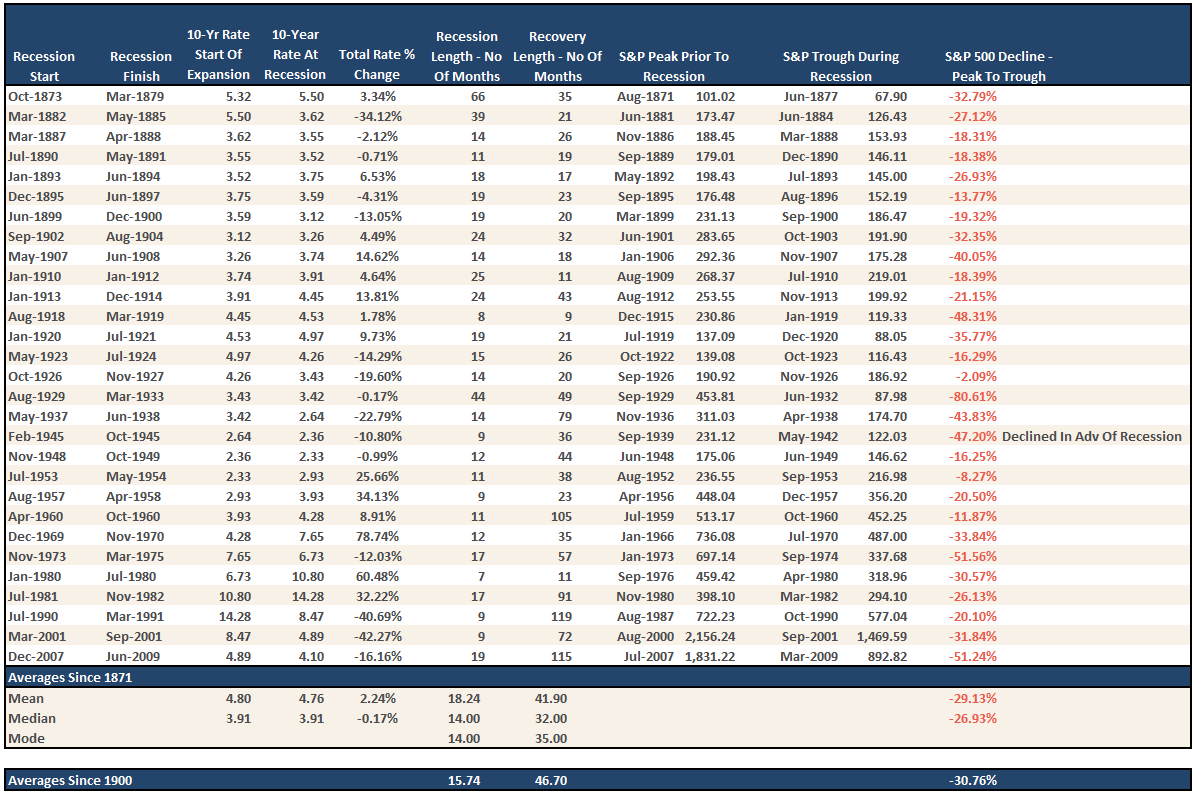
Importantly, note that the average recessionary drawdown historically is about 30%. While there were certainly some recessionary drawdowns which were very small, the majority of the reversions, particularly from more extreme overvaluation levels as we are currently experiencing, have not been kind to investors.
So, why bring this up?
“In the starkest warning yet about the upcoming global recession, which some believe will hit in late 2019 or 2020 at the latest, the IMF warned that the leaders of the world’s largest countries are ‘dangerously unprepared’ for the consequences of a serious global slowdown. The IMF’s chief concern: much of the ammunition to fight a slowdown has been exhausted and governments will find it hard to use fiscal or monetary measures to offset the next recession, while the system of cross-border support mechanisms — such as central bank swap lines — has been undermined.” – David Lipton, first deputy managing director of the IMF.
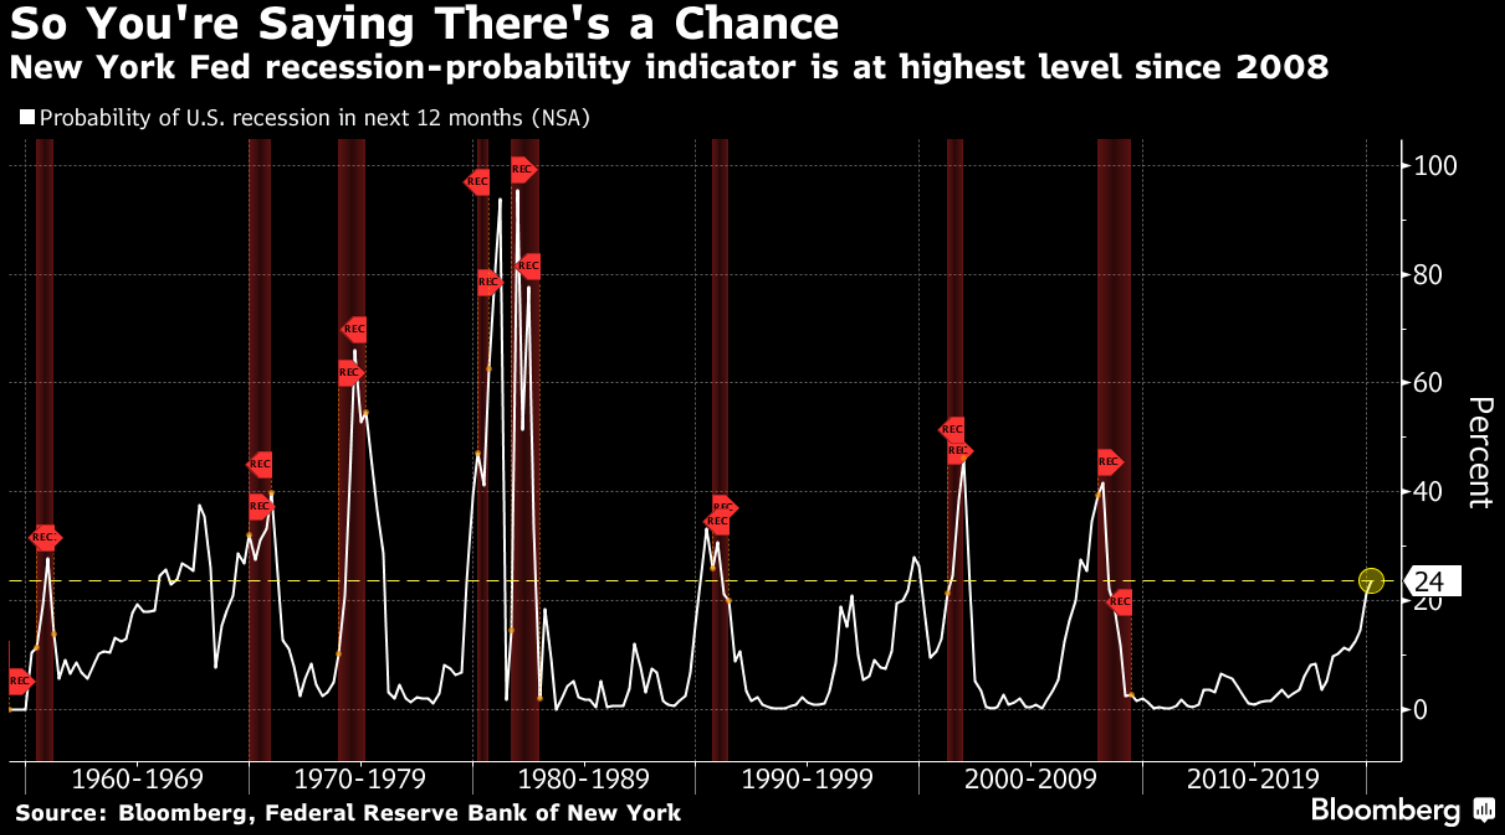
Despite recent comments that “recession risk” is non-existent, there are various indications which suggest that risk is much higher than currently appreciated. The New York Federal Reserve recession indicator is now at the highest level since 2008.
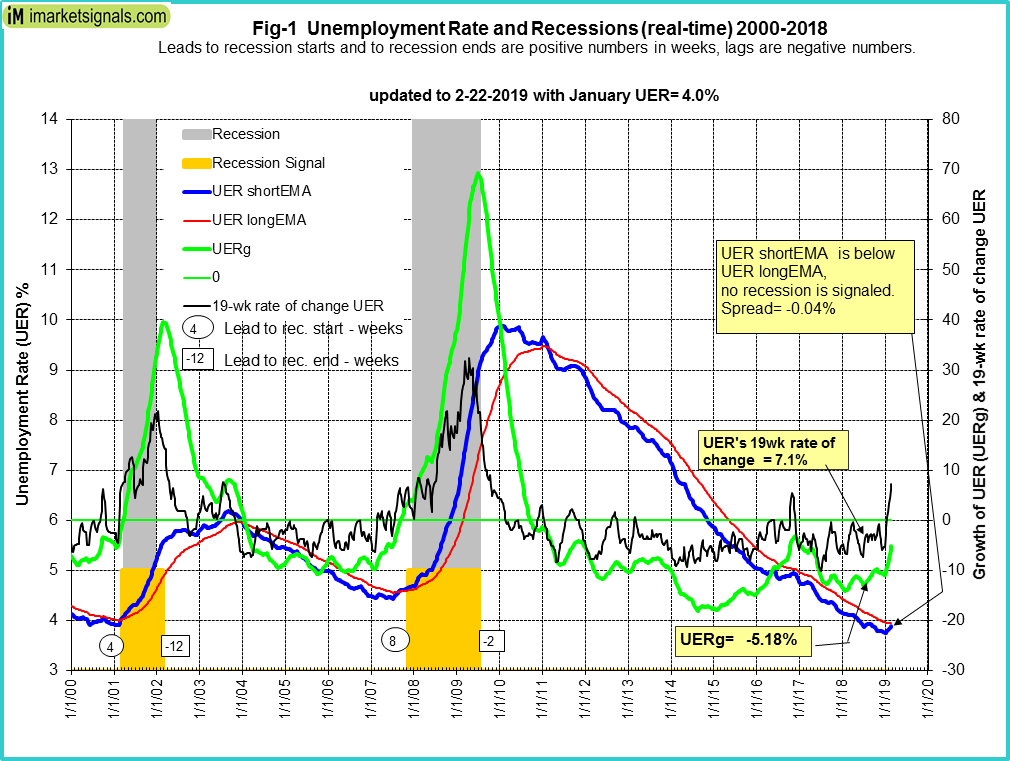
Also, as noted by George Vrba recently, the unemployment rate may also be warning of a recession as well.
“For what is considered to be a lagging indicator of the economy, the unemployment rate provides surprisingly good signals for the beginning and end of recessions. This model, backtested to 1948, reliably provided recession signals.
The model, updated with the January 2019 rate of 4.0%, does not signal a recession. However, if the unemployment rate should rise to 4.1% in the coming months the model would then signal a recession.”
John Mauldin also recently noted the same:
“This next chart needs a little explaining. It comes from Ned Davis Research via my friend and business partner Steve Blumenthal. It turns out there is significant correlation between the unemployment rate and stock returns… but not the way you might expect.
Intuitively, you would think low unemployment means a strong economy and thus a strong stock market. The opposite is true, in fact. Going back to 1948, the US unemployment rate was below 4.3% for 20.5% of the time. In those years, the S&P 500 gained an annualized 1.7%.”
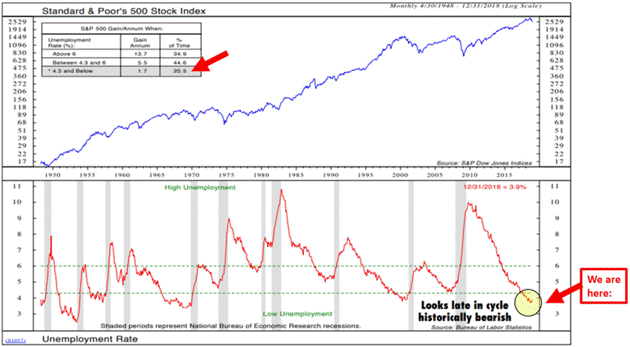
“Now, 1.7% is meager but still positive. It could be worse. But why is it not stronger? I think because unemployment is lowest when the economy is in a mature growth cycle, and stock returns are in the process of flattening and rolling over. Sadly, that is where we seem to be right now. Unemployment is presently in the ‘low’ range which, in the past, often preceded a recession.
The yield spread between the 10-year and the 2-year Treasury yields is also suggesting there is a rising risk of a recession in the economy.
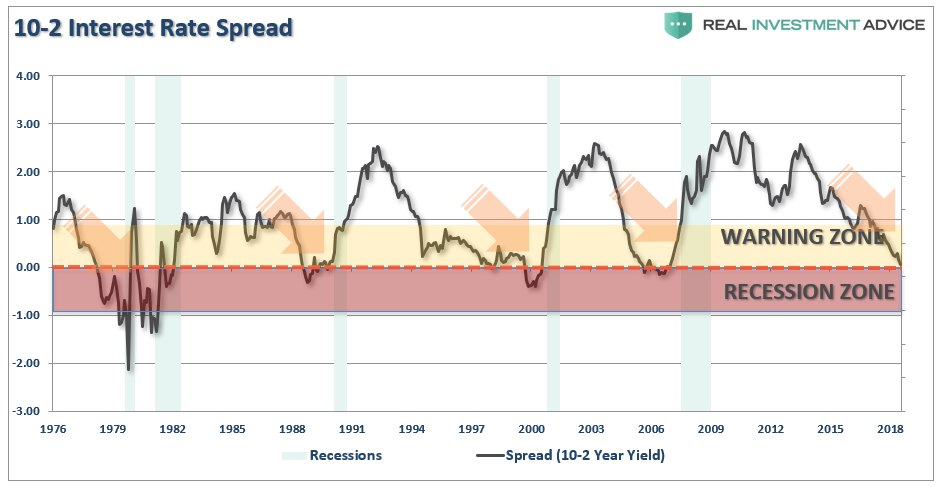
As I noted previously:
“The yield curve is clearly sending a message that shouldn’t be ignored and it is a good bet that ‘risk-based’ investors will likely act sooner rather than later. Of course, it is simply the contraction in liquidity that causes the decline which will eventually exacerbate the economic contraction. Importantly, since recessions are only identified in hindsight when current data is negatively revised in the future, it won’t become ‘obvious’ the yield curve was sending the correct message until far too late to be useful.
While it is unwise to use the ‘yield curve’ as a ‘market timing’ tool, it is just as unwise to completely dismiss the message it is currently sending.”
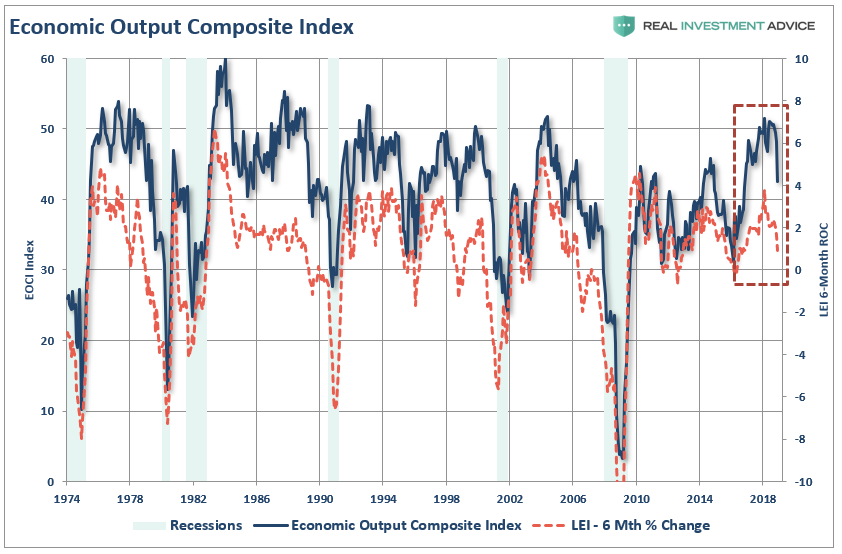
We can also see the slowdown in economic activity more clearly we can look at our RIA Economic Output Composite Index (EOCI). (The index is comprised of the CFNAI, Chicago PMI, ISM Composite, All Fed Manufacturing Surveys, Markit Composite, PMI Composite, NFIB, and LEI)
“As shown, over the last six months, the decline in the LEI has actually been sharper than originally anticipated. Importantly, there is a strong historical correlation between the 6-month rate of change in the LEI and the EOCI index. As shown, the downturn in the LEI predicted the current economic weakness and suggests the data is likely to continue to weaken in the months ahead.”
With the exception of the yield curve, which is “real time,” the rest of the data is based on economic data which has a multitude of problems.
There are many suggesting currently that based on current economic data, there is “no recession” in sight. This is based on looking at levels of economic data versus where “recessions” started in the past.
But therein lies the biggest flaw.
“The problem with making an assessment about the state of the economy today, based on current data points, is that these numbers are ‘best guesses’ about the economy currently. However, economic data is subject to substantive negative revisions in the future as actual data is collected and adjusted over the next 12-months and 3-years. Consider for a minute that in January 2008 Chairman Bernanke stated:
‘The Federal Reserve is not currently forecasting a recession.’
In hindsight, the NBER called an official recession that began in December of 2007.”
The issue with a statement of “there is no recession in sight,” is that it is based on the “best guesses” about the economy currently. However, economic data is subject to substantive negative revisions in the future as actual data is collected and adjusted over the next 12-months and 3-years. Consider for a minute that in January 2008 Chairman Bernanke stated:
“The Federal Reserve is not currently forecasting a recession.”
In hindsight, the NBER called an official recession that began in December of 2007.
But this is almost always the case. Take a look at the data below of real (inflation-adjusted)economic growth rates:
- September 1957: 3.07%
- May 1960: 2.06%
- January 1970: 0.32%
- December 1973: 4.02%
- January 1980: 1.42%
- July 1981: 4.33%
- July 1990: 1.73%
- March 2001: 2.31%
- December 2007: 1.97%
Each of the dates above shows the growth rate of the economy immediately prior to the onset of a recession. In 1957, 1973, 1981, 2001, 2007 there was “no sign of a recession.”
The next month a recession started.
So, what about now?
“The recent decline from the peak in the market, is just that, a simple correction. With the economy growing at 3.0% on an inflation-adjusted basis, there is no recession in sight.”
Is that really the case or is the market telling us something?
The chart below is the S&P 500 two data points noted.
The green dots are the peak of the market PRIOR to the onset of a recession. In 8 of 9 instances, the S&P 500 peaked and turned lower prior to the recognition of a recession. The yellow dots are the official recessions as dated by the National Bureau of Economic Research (NBER) and the dates at which those proclamations were made.
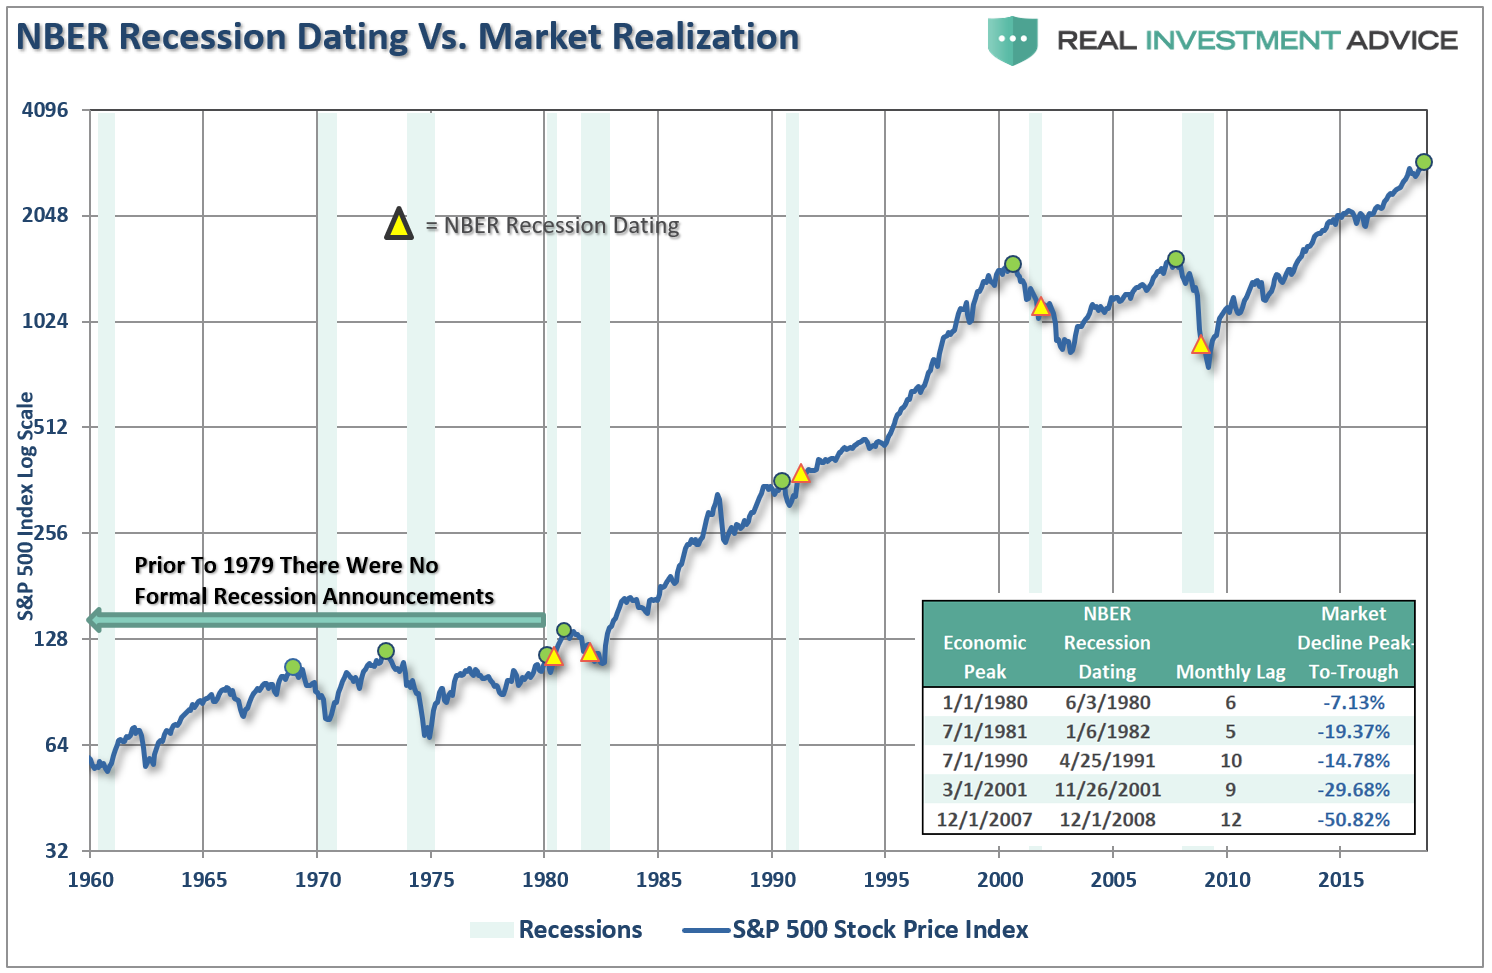
At the time, the decline from the peak was only considered a “correction” as economic growth was still strong.
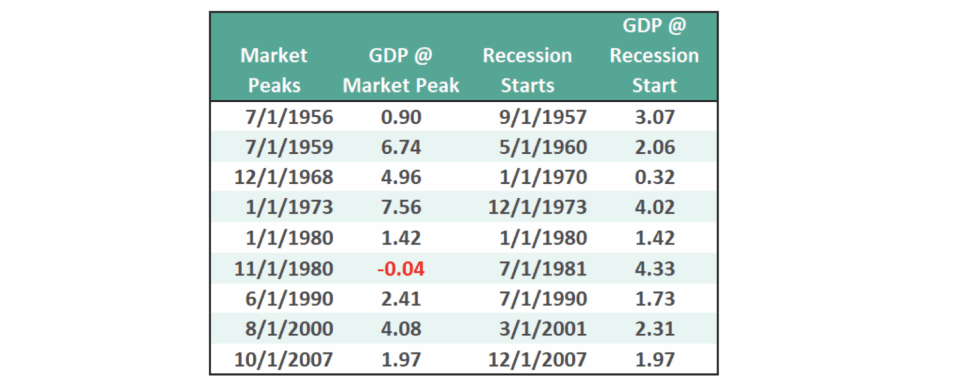
In reality, however, the market was signaling a coming recession in the months ahead. The economic data just didn’t reflect it as of yet. (The only exception was 1980 where they coincided in the same month.) The chart below shows the date of the market peak and real GDP versus the start of the recession and GDP growth at that time.
The problem is in waiting for the data to catch up.
Today, we are once again seeing many of the same early warnings. If you have been paying attention to the trend of the economic data, the stock market, and the yield curve, the warnings are becoming more pronounced. In 2007, the market warned of a recession 14-months in advance of the recognition.
So, therein lies THE question:
Is the market currently signaling a “recession warning?”
Everybody wants a specific answer. “Yes” or “No.”
Unfortunately, making absolute predictions can be extremely costly when it comes to portfolio management.
There are three lessons to be learned from this analysis:
- The economic “number” reported today will not be the same when it is revised in the future.
- The trend and deviation of the data are far more important than the number itself.
- “Record” highs and lows are records for a reason as they denote historical turning points in the data.
As Doug Kass noted on Tuesday there are certainly plenty of risks to be aware of:
- Domestic economic growth weakens, Chinese growth fails to stabilize and Europe enters a recession
- U.S./China fail to agree on a trade deal
- Trump institutes an attack on European Union trade by raising auto tariffs
- U.S. Treasury yields fail to ratify an improvement in economic growth
- The market leadership of FANG and Apple (AAPL) subsidies
- Earnings decline in 2019 and valuations fail to expand
- The Mueller Report jeopardizes the president
- A hard and disruptive Brexit
- Crude oil supplies spike and oil prices collapse, taking down the high-yield market
- Draghi is replaced by a hawk
While the call of a “recession” may seem far-fetched based on today’s economic data points, no one was calling for a recession in early 2000, or 2007, either. By the time the data is adjusted, and the eventual recession is revealed, it won’t matter as the damage will have already been done.
Pay attention to the message markets are sending. It may just be saying something very important.
Check out the these top trending RTD videos to get the real scoop. (100k+ YouTube Views)
1) (We Are In A National Crisis) Did You Hear What Trump Said?
https://youtu.be/15hDwzkWnV8
2) Trump And A New Gold-Backed Dollar
https://youtu.be/PQzrtvEtTgw
3. RTD Ep:69 “A Reset Of All The Global Fiat Currencies Against Gold” – Kevin Massengill
https://youtu.be/IVZdSJ6zENI


0 Comments