

The U.S. Treasury yield curve, depicted by maturities on a horizontal axis and corresponding interest rates (yields) on a vertical axis, is normally upward sloping, with yields on bonds (10-year maturity and beyond) and notes (intermediate term) lying above yields on bills (short term). Infrequently – but importantly, for economic and investment forecasting – the yield curve becomes inverted, with long-term bond yields lying below short-term bill yields.
Over the past half century in the U.S., yield-curve inversions have been important because they’ve reliably predicted all seven U.S. recessions, beginning roughly a year in advance (see table). Those recessions, of course, have been closely associated with bear markets in stocks and bull markets in bonds. It matters a lot – or it should, for those who care about portfolios.
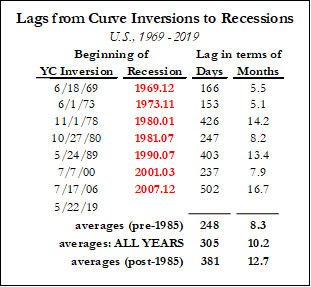
The yield curve’s forecasting record since 1968 has been perfect: not only has each inversion been followed by a recession, but no recession has occurred in the absence of a prior yield-curve inversion. There’s even a strong correlation between the initial duration and depth of the curve inversion and the subsequent length and depth of the recession.
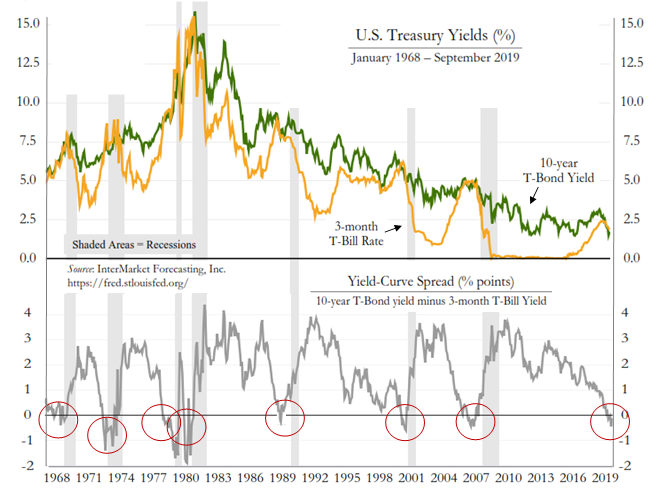
Having conducted substantial research and issued scores of reports in recent decades on the yield curve’s meaning and forecasting power, I’ve found that the curve is best measured as the spread between the 10-year Treasury bond yield and the 3-month Treasury bill rate – what I call the “yield-curve spread” (YCS). A negative YCS depicts inversion.

Many analysts discount or dismiss the yield curve’s forecasting power, whether because they adopt measures over shorter time periods, or in pre-1968 periods, or use less relevant yields (like the 2-year yield). Inferior models invalidate not the yield curve’s predictive power but these modelers’ methods.

The figure below depicts the U.S. bond yield, bill yield, and yield-curve spread since 1968. Notice that negative spreads preceded all recessions. Observe also that it hasn’t mattered whether yields generally have been high or low, nor whether the yield curve’s inversion has resulted mainly from short-term (bill) yields rising above long-term (bond) yields (due mainly to Fed rate hiking) or instead (and less frequently) from bond yields falling below bill yields.

Despite the yield curve’s remarkable predictive history, many economists still doubt it or deny it, to the extent they’re eclectics (uneasy about relying on any one factor) or skeptics (uneasy about ever exhibiting certitude). Most officials and economists at the Fed are likewise eclectic skeptics; their favorite refrain is that “it’s different this time.” They said as much when the yield curve inverted before the “Great Recession,” which began in December 2007. That recession was fully predictable – indeed, was predicted by this YCS model– a year in advance.
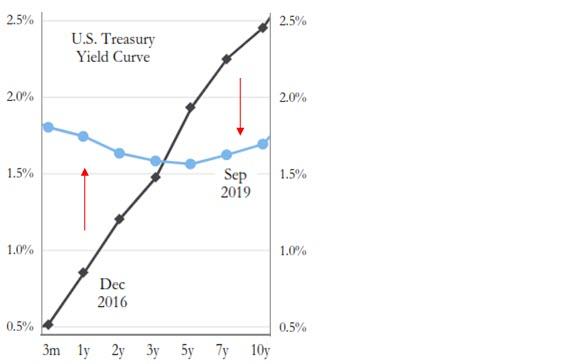
The U.S. yield curve is again inverted – indeed, it has been since May. That signals trouble ahead for the U.S. economy and equities. The trouble isn’t necessarily imminent, but no one need become complacent; remember, there’s a lag. Yet it’s unlikely that no trouble will ensue.
A few good reasons explain the undeniable forecasting power of an inverted yield curve.
First, a sharp decline in bond yields means a sharp rise in bond prices, which suggests a big demand for a safe security, reflecting a desire by investors to immunize against trouble ahead.
Second, the longer the maturity at which one lends, the greater (normally) is the yield one receives (due to credit risk and/or inflation risk), so if bond yields are below bill yields it signals materially lower short-term yields in the future (i.e., Fed rate cutting), which occurs during recessions.
Third, the essence of financial intermediation is institutions “borrowing short (term) and lending long (term).” If longer-term yields are above shorter-term yields, as is the normal case, there’s a positive interest-rate margin, which means lending-investing is fundamentally profitable. If instead longer-term yields are below shorter-term yields, there’s a negative interest-rate margin and lending-investing becomes fundamentally unprofitable or is conducted (if at all) at a loss. When market analysts observe credit markets “seizing up” before (and during) recessions, it reflects this crucial aspect of financial intermediation.
If the U.S. yield curve exhibited predictive power only in the U.S., it would still be an important thing to know and use. But it also contributes to reliable forecasts of economic-financial results abroad, especially when coupled with signals from local yield curves.
Economists, investors, and policy makers would do well to take seriously the predictive power of the yield curve, to study and comprehend not only its empirical but also its causal features.


0 Comments