

The last trading day of February wrapped up one of the worst weeks for stock markets within the last 20 years, with US and worldwide equity markets reeling amid a deep and sustained selloff triggered by the explosion of clusters of coronavirus (COVID-19) cases outside of China, and the markets’ fear as to how this will impact global economic growth, trade flows, supply chains and earnings.
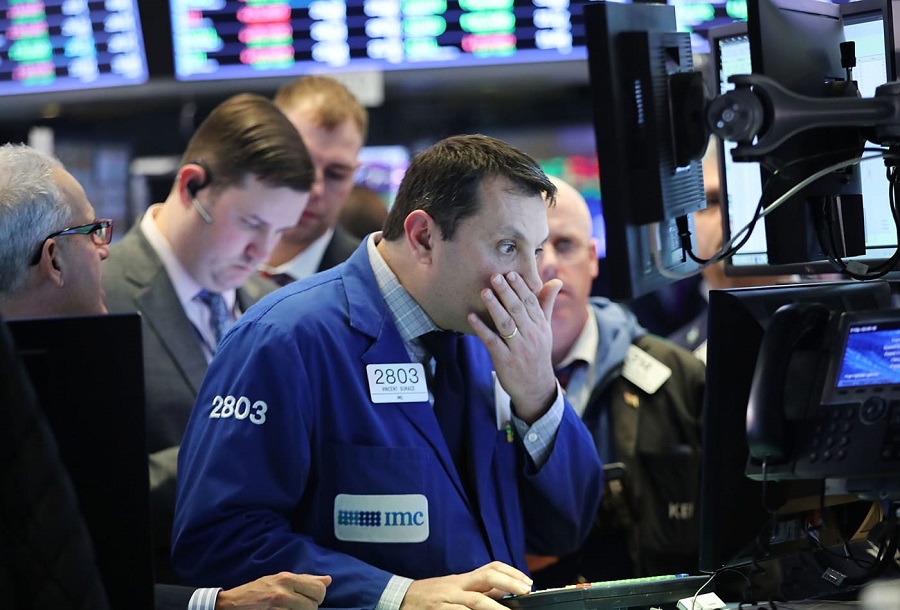
Panic on Wall Street
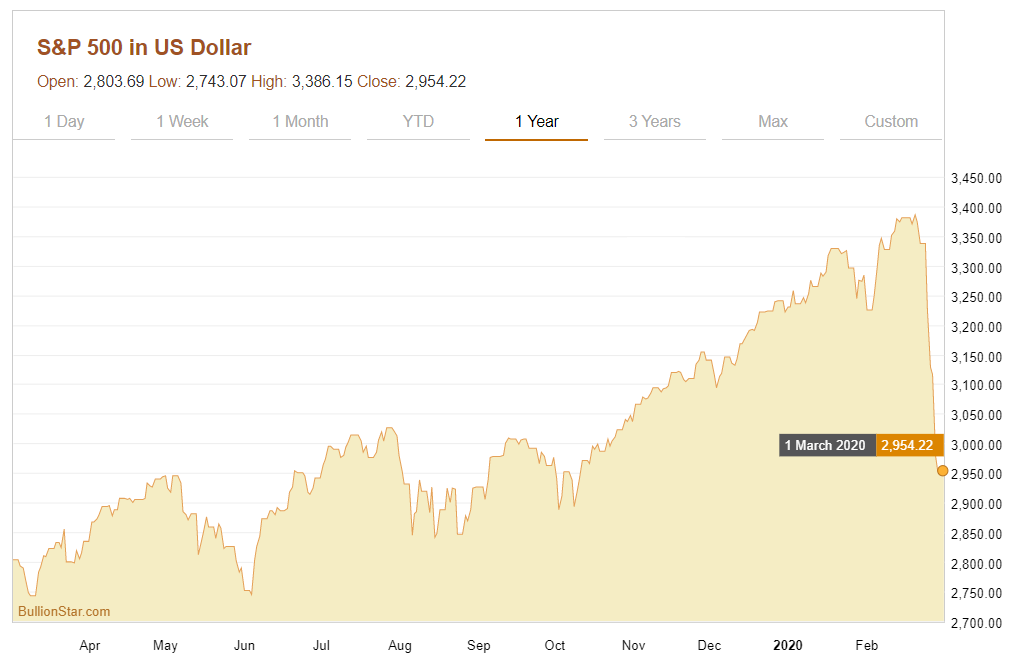
Over the week from 24 February to 28 February, US stock market indices entered correction territory with the benchmark Dow Jones Industrial Average (DJIA) falling 12.4% on the week, the broader S&P 500 index closing 11.5% lower, and the NASDAQ Composite off by 10.5% lower over 5 day trading period. ‘Buying the dip’ was nowhere to be seen with the Dow and the S&P falling during seven straight sessions into Friday’s close and all three indices recording the worst weekly performance since 10 October 2008 at the height of the global financial crisis.
Equity markets across Europe and Asia followed suit, with the FTSE 100 in London down 13% on the week, the pan-European Stoxx 600 index 12.7% lower, and Japan’s Nikkei 225 off by 9.6%. Other Asian centers reflected a similar rout, with indices from Hong Kong’s Hang Seng to Singapore’s Straits Times index all ending the week substantially lower in a sea of red.
As stock prices fell, stock market volatility soared, with the CBOE Volatility Index (VIX), the US market’s ‘fear gauge’, spiking to as highest level since the 2008-09 financial crisis. Oil prices also plunged on the back of fears over a contraction of economic and transport activity, and the WTI Crude benchmark price down more than 16% on the week, also its worst weekly percentage fall since 2008.
Amid this fear and flight from risk assets, sovereign bond prices such as the US were bid up on safe-haven demand and yields on US treasuries plummeted, with the yield on the US 10-year treasury falling on Friday to a record low of 1.16%, and 2 and 5 year US treasury yields falling below 1%, which in turn prompted market expectations of imminent official interest rate cuts.
The stock market slump and bond yield action also promoted the US Federal Reserve to uncharacteristically release a short statement Friday afternoon in which it tried to talk down the fear while signaling Fed rate intervention:
“The fundamentals of the U.S. economy remain strong. However, the coronavirus poses evolving risks to economic activity. The Federal Reserve is closely monitoring developments and their implications for the economic outlook. We will use our tools and act as appropriate to support the economy.”
This statement and the bond yield moves point to financial markets now looking for a US rate cut of between 25 and 50 basis points. Whether this will be at the Fed’s next scheduled meeting on 18 March or even sooner remains to be seen.
Golden Mirage
But what about the gold price in all of this and of gold’s reaction to recent market volatility? Firstly, it’s worth mentioning that over the last year, the US gold price had been performing strongly, independent of any coronavirus related news coming out of China or elsewhere. For example, during 2019 the US dollar gold price took out key psychological levels, rising up through each of the 1300, 1400 and 1500 marks. Early this year saw this trend continuing with the US gold price reaching the 1580 level two weeks ago. As stock market levels began keeling over in the week beginning 17 February, the upward trajectory of the US dollar gold became noticeably steeper, with the gold price ending on Friday 21 February at the 1644 mark.
Beginning 24 February, the day in which global stock market fear really took hold, gold, not surprisingly opened markedly higher at Asia market open, spiking up to 1686.5 at one point in the early trading day.

Notably, this was a seven year high in US dollars (since 23 January 2013), and also an all-time-high (ATM) in a whole host of major fiat currencies such as the Euro, Australian dollar, Canadian dollar, Japanese yen, Swedish krona, New Zealand dollar, Indian rupee, Brazilian real, South African rand, Danish krone, Indonesian rupiah, Malaysian ringgit.
However, Monday’s intraday high didn’t hold, with COMEX futures prices (GC COMEX 100 oz gold futures) dropping in afternoon trading. Over the next three days from Tuesday to Thursday, during which US and global markets continued to plunge, the US dollar gold price chopped sideways in the 1630-1650 range, continually hitting a ceiling in the 1650 zone. Unable to break through this ceiling, the US dollar gold price then turned lower on Friday, coming under extreme pressure on the COMEX with gold future prices falling more than 4.6% during the day, the worst one day percentage loss in gold prices since November 2016.
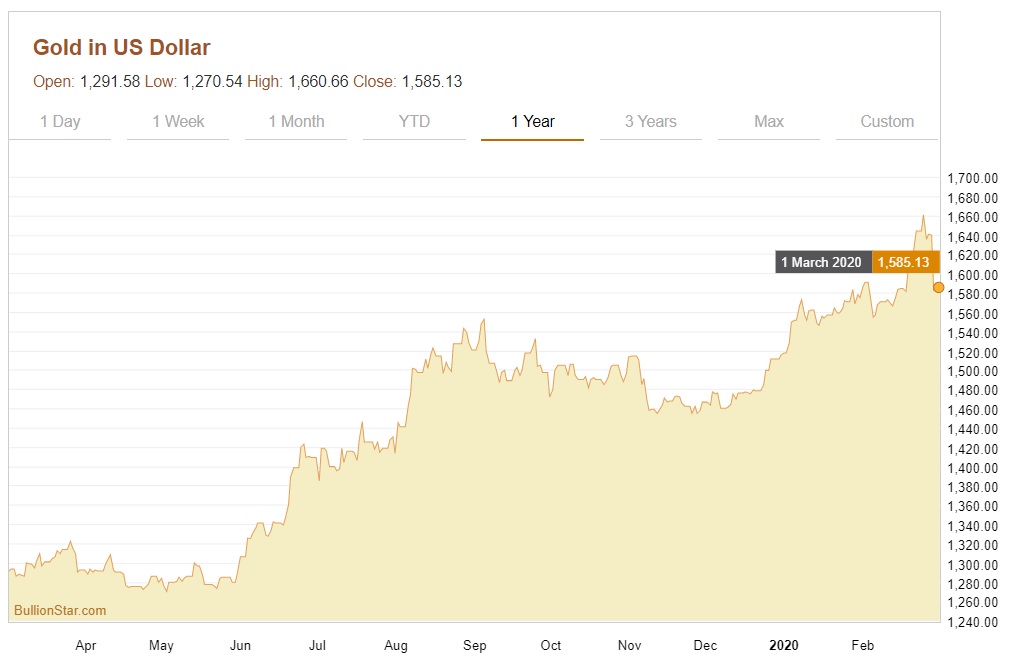
Closing the week at about 1585, this meant that over the week from Monday to Friday there was a $100 gold price reversal with the bulk of the impact on Friday. An uncharacteristic price pattern for a safe-haven asset in times of extreme market crisis. Unexpected enough for mainstream financial news agencies to question the price action, with for example Bloomberg pondering that:
“It is an odd moment for gold to be tumbling. One of the oldest and most-trusted safe havens in times of crises, gold typically rallies amid nasty stock sell-offs like the one that has gripped the world this week…


0 Comments