

Gold’s Worst Week In 3 Months
Gold Scoreboard
The price of Gold has been fairly firm these recent weeks, and rightly so given global goings-on. So it seems rather out-of-sorts to cite that Gold just put in its worst week of the last 13 (stretching all the back to that ending 08 November) in netting a -1.2% change by settling Friday at 1574.

Which really is a testament to just how positive Gold has been of late: our sense of the week’s price movement was its being basically ho-hum, rather than having amounted to the most negative net weekly loss in three full months … “Whoomp! (There It Is)”…
Pardon our not having immediately picked up on that; instead, it took some key eying at the comparative closing nubs across Gold weekly bars, followed for verification via worksheet calculation to ferret it all out. Indeed in looking below at said bars, hardly does the recent run look negative whatsoever:
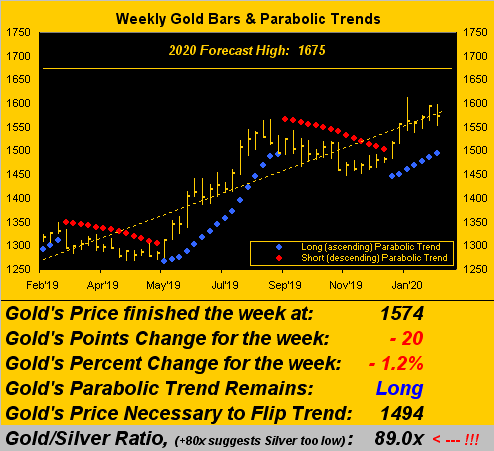
Gold Weekly Bars & Parabolic Trends
Nonetheless, the oscillating global yo-yo of “Oh-no!” has produced some significant swings in Gold’s price. Four weeks back, the U.S.’ precision strike in the Middle East brought on the “Oh-no we’re going to war” fears and the price of Gold spiked from 1552 to 1613 only to return from whence it came in just 30 hours.
Two weeks back, the deadly coronavirus proliferation from China brought on the “Oh-no we’re going to die” fears and the price of Gold resurged to 1598 only to again settle back ’round the present price. The upshot as made clear in the above chart is Gold’s being in a price uptrend with still plenty of room for pullbacks without disturbing the ongoing upward glide of parabolic Long trend.

Indeed for the Gold trader, ’tis been two solid months of “buy the dip and enjoy the trip” … were it only always this easy, eh? But as the late great Richard Russell would remind us, there’s never a bad time to buy Gold … to which we’d humbly edify unless price has well overshot debasement value, that as you no doubt noted in the opening Gold Scoreboard is now $3,015/oz., 92% above the current 1574 level; and we’re looking (at least for this year) to merely 1675. Methodically modest may be our call.
Moreover, from the “Nothing Is Easy Dept.” there’s always the “But, what if…” with which to deal. Even the most hardened Gold investor ought take note of price vis-à-vis its 300-day moving average. At present, price (1574) is 12% above said average (1401); albeit more importantly the average itself is firmly rising. Still, on an absolute value basis (which for you WestPalmBeachers down there allows us to calculate distance of price from average regardless of their juxtaposition), the present 12% divergence is nearly double the millennium-to-date median.
Just something of which to be wary. Wise as well per the website is to track distances from norms on both the Market Values and Market Magnets pages. Warnings notwithstanding, we like what we’re watching:
By Mark Mead Baillie for Investing.com

RTD 1oz. Round
RTD 5oz. Round


0 Comments