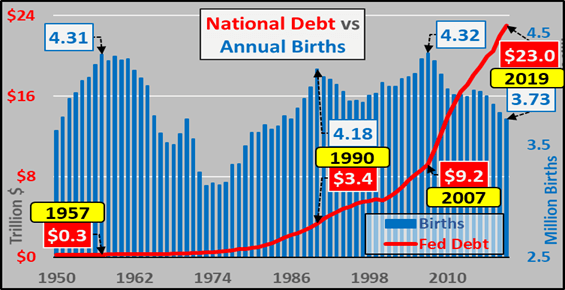
Since 2007, US federal debt has risen 150% while annual US births (legal and otherwise) have fallen almost 14%. Said otherwise, over the dozen years since 2007, federal debt has increased by $13.8 trillion while 5.2 million fewer births have occurred over the same period than the Census projected. This is probably worth a little closer look. Starting with…
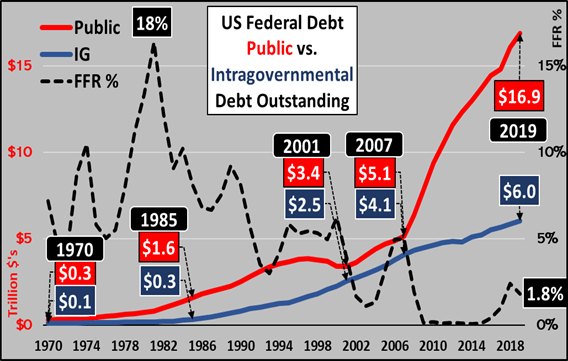
US federal debt, split between publicly held debt and IG (Intra-Governmental holdings; aka Social Security trust fund, etc.). Clearly, publicly held debt is skyrocketing since 2007 while IG growth is decelerating and will turn to net declines (as SS turns to a net seller) within the decade. Relatively soon, all debt issued will be marketable and significantly more debt will be needed in order to pay for both the spiraling deficit alongside the declining IG holdings.
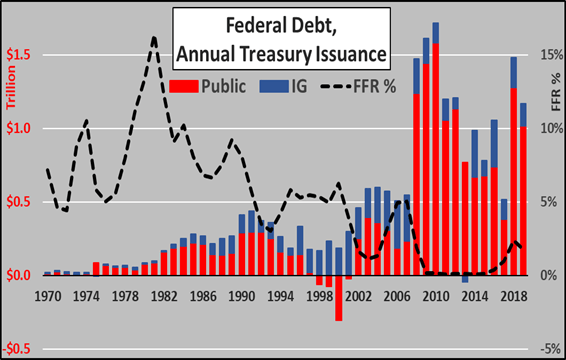
Next, looking at the annual issuance of federal debt, breaking out the annual issuance of publicly held marketable debt (red columns) versus IG (blue columns). ***Noteworthy, since August 1st of 2019, the Treasury has issued $920 billion in net new debt through October 23rd. The chart below is based on the assumption the Treasury will issue another $160 billion through the last two months plus the remainder of October (with a net issuance of $1.1 trillion for calendar year 2019).
Since debt is an obligation to be repaid or serviced in the future, I’ll put this in context with federal debt continuously divided by the future, the quantity of annual births. Below, annual births from 1950 through 2019 (blue columns) versus federal debt through 2019 (red line). ***Yes, I’m making a great leap to note that births will continue to fall in 2019…as they have been falling at an accelerating rate through Q1 of 2019, as noted by the CDC (HERE).
Dividing federal debt by total annual births, from 1946 through 1975 (below). As of 1946, coming out of a world war with debt at record levels, every child born had the future liability of $100,000 in federal debt. By 1957, births had risen and federal debt had declined, meaning this responsibility per child born had declined by almost 40% to just $63,000. Federal debt per child born wouldn’t be back to the 1946 highwater mark until 1970. But there would be no looking back after the abandonment of Bretton Woods and the foundation of the gold back dollar in 1971.
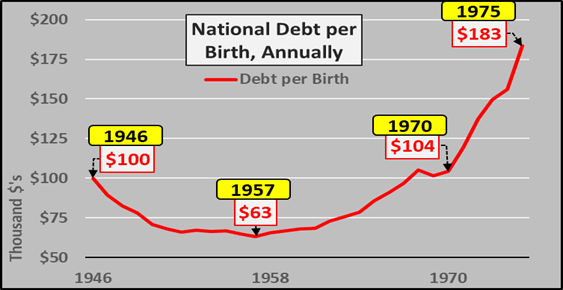
The then present generation (baby boomers) made a deal with the past generation to sell out the future generation (Millennials). This can be seen in the chart below, showing the debt each child is born shackled with. From $100 thousand in 1970, to $300 thousand in 1980, to $800 thousand in 1990, $2.1 million in 2007…and as of 2019, every child born a citizen of the US (regardless their parents status) is liable for a ludicrous $6.2 million in federal debt. And this is just a fraction of the actual liability that is owed, if even faster rising unfunded liabilities were included.
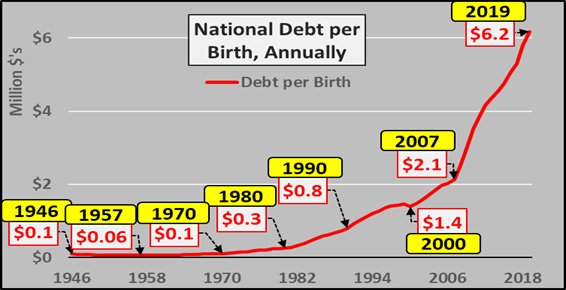
To repeat, since 2007, total births have declined almost 14% versus a 150% increase in federal debt. But we continue piling exponential debt on a declining future population and deride those who question the morality of such an obligation? And the growth of the US child bearing population is rapidly decelerating while tumbling fertility rates are overwhelming the larger child bearing population (detailed HERE). Translation, federal debt will continue skyrocketing while present and future births are likely to continue tumbling.
Of course, there is no way the US could ever repay this mounting debt even with a rising population of young…let alone a declining population of young. But it is the “servicing” of the mounting debt that is destroying the Millennials and future generations. The ZIRP, QE, etc. are effectively pushing asset prices through the roof with the follow through of record rents, day care, insurance, student debt, etc. etc. rising far faster than young adults income.
These policies of Federal Reserve driven asset appreciation primarily benefit asset holders, corporations, and those deeply indebted (federal government). As detailed (HERE), the 70+ year-old population will represent an unprecedented 75% of the US population growth over the next two decades. These policies meant to “kick the can down the generational road” continue to suffocate the asset-poor young adults and restrict the creation of newborn. The outcome of ever accelerating debt via perpetually lower rates (to zero and below)…is the resultant collapsing birth rates and the more the Fed and central banks will suggest even more of what is making the patient sick in the first place.


0 Comments