2020 Top 10 Watch List
In this report, we follow our January recap with a discussion of our Top 10 List of things for gold investors to watch in 2020.
Gold Climbs 4.7% in January…after Gaining 18.31% in 2019
In January, gold bullion rallied 4.74% or $72/oz to close at $1,589, reaching its highest level since early 2013. It is also at the critical resistance level before a breakout above the $1,600 level. Gold equities (SGDM)1 declined about 0.83% lagging gold bullion’s performance, most likely as the December performance was so strong. With yields probably heading lower until the coronavirus panic ceases, gold remains well supported by lower yields and a flight to safety.
| Indicator | 1/31/2020 | 12/31/2019 | Change | % Chg | Analysis |
| Gold Bullion | $1,589 | $1,517 | $71.89 | 4.74% | Highest close since 2013 |
| Silver Bullion | $18.04 | $17.85 | $0.19 | 1.07% | Regaining $18 level |
| Gold Equities (SGDM)1 | $24.94 | $25.15 | ($0.21) | (0.83)% | Still building a bullish consolidation |
| Gold Equities (GDX)2 | $28.99 | $29.28 | ($0.29) | (0.99)% | same as above |
| DXY US Dollar Index3 | 97.39 | 96.39 | 1.00 | (1.04)% | DXY Intermediate topping process |
| U.S. Treasury 10 YR Yield | 1.51% | 1.92% | (0.41)% | (21.42)% | Back to low end of range |
| German Bund 10 YR Yield | (0.43)% | (0.19)% | (0.25)% | 134.6% | Recovery over, breaking lower |
| U.S. Treasury 10 YR RealYield | (0.14)% | 0.13% | (0.27)% | (206.33)% | New low |
| Total Negative Debt ($Trillion) | $13.91 | $11.24 | $2.67 | 23.76% | Bottomed and heading higher |
| CFTC Gold Non-Comm Net Position4 and ETFs (Millions of Oz) | 118.14 | 113.65 | 4.50 | 3.96% | New all-time high, buying reaccelerating |
January Ushers in China’s Coronavirus
January started with a jolting geopolitical event (a U.S. missile strike against Iran) and ended with fear of a possible global pandemic. Gold spiked to an overnight high of $1,611 on January 8 but traded lower in the $1,550 to $1,560 range a few days later as the market priced in that no further military escalation was likely. Into the last week of January, news of the scale and severity of China’s coronavirus outbreak emerged, and gold began to rally as yields started their trek back to near all-time lows.
Yields were already struggling to rise to confirm the reflation trade before the virus outbreak. But with fears of the coronavirus spreading, yields have broken lower and have likely removed the reflation narrative for the next few months. Since the epicenter of the coronavirus outbreak is in China, and China has been one of the primary drivers of global growth, these fears are well placed. However, the speed of the drop in yields would suggest convexity flows (i.e., buying bonds to readjust their risk exposure to yields) are back again, similar to the action we saw in August 2019. Bond yields could drop further despite the already quick drop.
The U.S. 2-10 year Treasury yield curve is reflecting this as it continues to flatten. Inflation breakevens are also rolling over, and 10-year TIPS (Treasury Inflation Protected Securities) yields closed negative at (0.14)%, a new low this cycle. (TIPS are designed to offer investors a way to insulate a bond against inflation; “inflation breakevens” are the level of inflation the TIPS market is pricing in over the life of the bond.)
2019 Recap
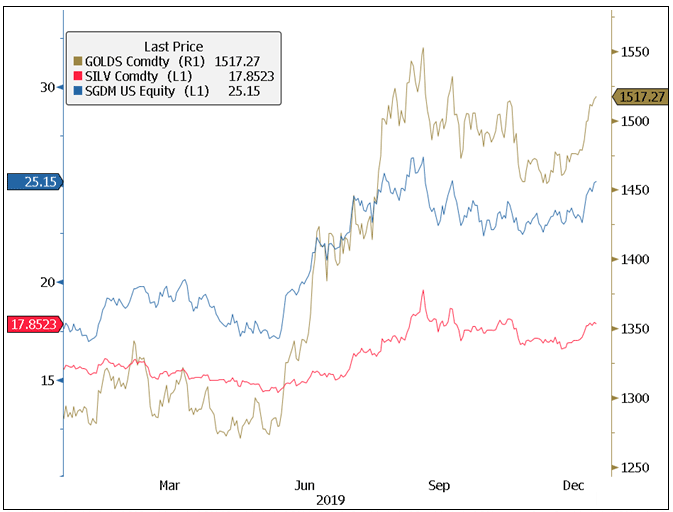
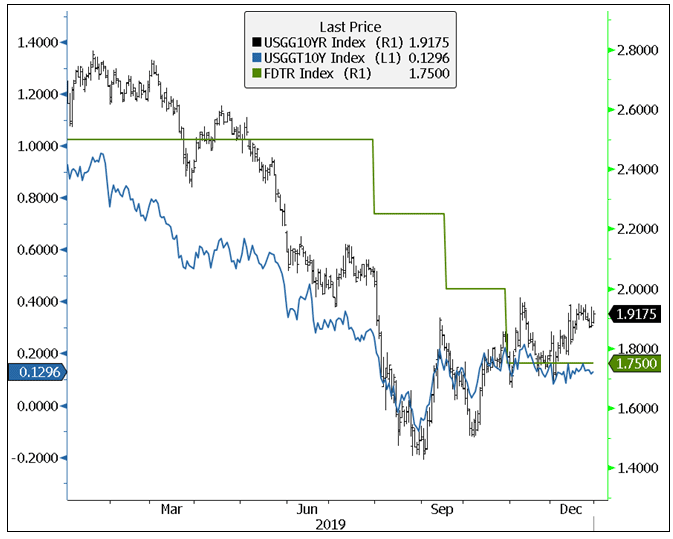
2019 was one of the best years for gold in recent history. Gold bullion rose from $1,282 to close at $1,517, increasing $235/oz, or 18.31%, while gold equities returned 43.49%.1Silver bullion closed at $17.85, an increase of $2.35 or 15.23% (Figure 1). As 2019 concluded, we ended up experiencing one of the sharpest declines in interest rates (measured by year-over-year percentage change; Figure 2), one of the largest number of central bank rate cuts outside of the 2008 financial crisis, and the expansion of the U.S.
Federal Reserve (“Fed”) balance sheet at a monthly rate surpassing even QE3 (the Fed’s third round of quantitative easing, which began in 2012). All without being even close to a recession or any signs of financial stress. This dramatic turnaround in outlook for interest rates and rate structures propelled gold bullion to break out of its multi-year base pattern.
Figure 1. Gold/Silver Bullion and Gold Equities Soar in 2019

Source: Bloomberg. Data as of 12/31/2019.
Figure 2. U.S. Yields Plummet and Real Yields Near 0% in 2019

Source: Bloomberg. Data as of 12/31/2019.
2020 Top 10 Watch List
Our 2020 Top 10 Watch List is informed by the events of 2018 and 2019. We are in the very late-cycle phase of the longest economic expansion in U.S. history. Debt has exploded and with it, the deficit. Growth has peaked, and central banks are stimulating at levels usually associated with recessions and financial crises.
Generally, as an economic cycle grows and matures, debt levels are brought down as government revenues expand relative to spending. Not this time, and not by a long shot.
The view we see in the long term is that nominal interest rates are likely to remain in a prolonged period of low yields. Real interest rates are likely to be zero to negative as a way of monetizing debt and keeping interest payments manageable.
If a recession were to start, or a financial crisis was to emerge, the ability of governments and central banks to cushion these events are limited, given that interest rates are already at record lows and debt is at record highs. The next crisis will likely occur when debt servicing obligations become stressed. The path of least resistance to address this will be to bring real interest rates further into very negative levels. And extreme negative real interest rates erode the value of almost all assets except one: gold.
The top 10 things for gold investors to watch in 2020:
#1. Gold Bullion Breaking Above $1,600
#2. Gold Stocks Should Continue to Rally with Gold Bullion
#5. Mean Reversion in Volatility
#6. The Cost of Credit Default Insurance
#7. Nominal Yields Rangebound at the Lower End
#9. Gold Equity to Gold Bullion Ratio
#10. Heightened Geopolitical Risk and a Pandemic
#1. Gold Bullion Breaking Above $1,600
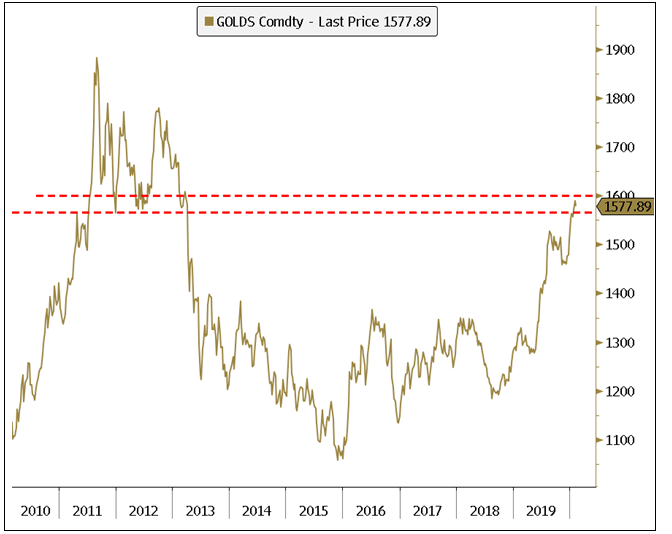
We highlighted this chart in our December commentary, but the importance of surpassing the last significant chart resistance level is critical. Once exceeded, the $1,600 to $1,800 trading range opens up, and after that, if macro conditions continue as we expect, new highs are likely within a few years.
Figure 3. Gold Bullion Reaches Last Major Resistance Level

Source: Bloomberg. Data as of 2/03/2020.
#2. Gold Stocks Should Continue to Rally with Gold Bullion
We highlighted this in December as well. Breaking through GDX’s $31.32 highs of August 2016 is likely to put in place a very bullish multi-year base pattern and will target the next significant resistance at $39.50. We have discussed before how, as the price of gold bullion rises, gold companies’ earnings rise even more.
Also, we emphasized several broad market valuation metrics; gold companies compare quite favorably to the general equity market. When the general equity market is at peak earnings power, gold mining companies are just starting their upcycle. One undeniable factor remains investor sentiment. After several years in a bear market and only now emerging into the bullish phase, gold equity sentiment is improving. A multi-year base bullish breakout will help lift sentiment.
BY PAUL WONG for Sprott

RTD 1oz. Round
RTD 5oz. Round


0 Comments